This article will explain how to do remote debugging with Visual Studio.
I had to debug a BizTalk application that is running on a remote integration server on which Visual Studio is not installed. Actually, the remote server was a Virtual Machine but that does not change anything.
I took the following steps to be able to debug the remote BizTalk process from my development machine on which Visual Studio is installed:
- Copy the Remote Debugger folder from the development machine (having Visual Studio installed) to the remote machine. If you don’t find it, its location can be found from Visual Studio’s start menu. For VS 2005, VS 2008, VS 2010 it respectively is:
- <Program Files>\Microsoft Visual Studio 8\Common7\IDE\Remote Debugger\
- <Program Files>\Microsoft Visual Studio 9.0\Common7\IDE\Remote Debugger\
- <Program Files>\Microsoft Visual Studio 10.0\Common7\IDE\Remote Debugger\
The <Program Files> token is Visual Studio installation folder which is by default
C:\Program Files (x86)\on 64 bit machines andC:\Program Files\on 32 bit machines. Note that on 64 bit machines, VS 2005 has the 64 bit remote debugger inC:\Program Files\and the 32 bit debugger inC:\Program Files (x86)\. VS2010 has all the debugger versions underC:\Program Files (x86)\. - Start Visual Studio Remote Debugging Monitor on the remote machine. The process is called
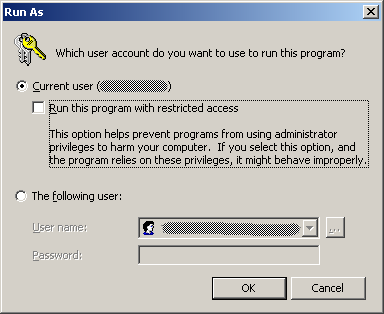
msvsmon.exe. I executed it with the “Run as” option using the domain user name that I use on my development machine to avoid credential issues and to give unrestricted access to the debugger process.
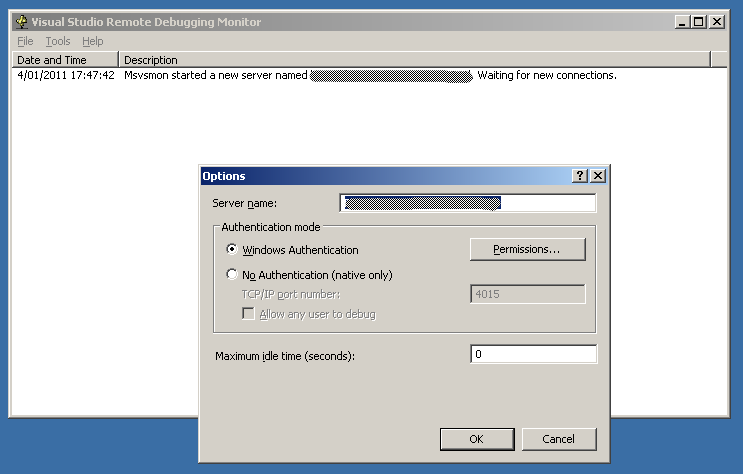
- After the remote debugging monitor process is started, copy the Server Name in the clipboard or in notepad. The Server Name is found by clicking Tools -> Options. The remote debugging monitor server name has the following format: DomainName\UserName@MachineName.
- Copy the necessary libraries and symbol files (.dll and .pdb) in a directory on the remote machine. For the sake of this example let’s put them in C:\Code\Debug
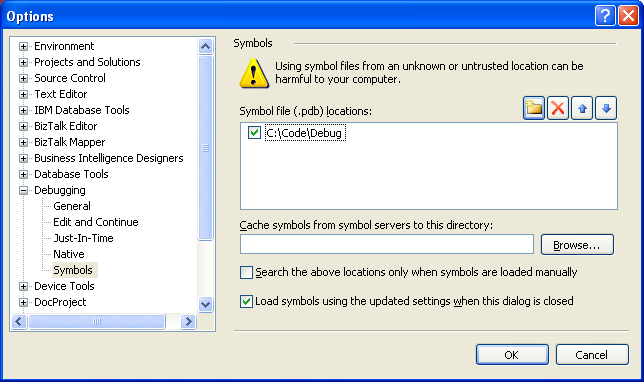
- Configure Visual Studio on the local development machine so that it can instructs the remote debugging monitor on where to find the symbol files (.pdb). To do that, open Visual Studio and go to Tools -> Options -> Debugging -> Symbols and set the path where msvsmon.exe can find the pdb files on the remote machine. It is C:\Code\Debug in our example.
- Attach the remote process to debug by Visual Studio’s debugger. When the project is loaded in Visual Studio and breakpoints are set, go to Debug -> Attach to Process. In the Qualifier field, put the Server Name published by the remote debugging monitor that we took note of in step 3. Click refresh so that the processes of the remote server are displayed.
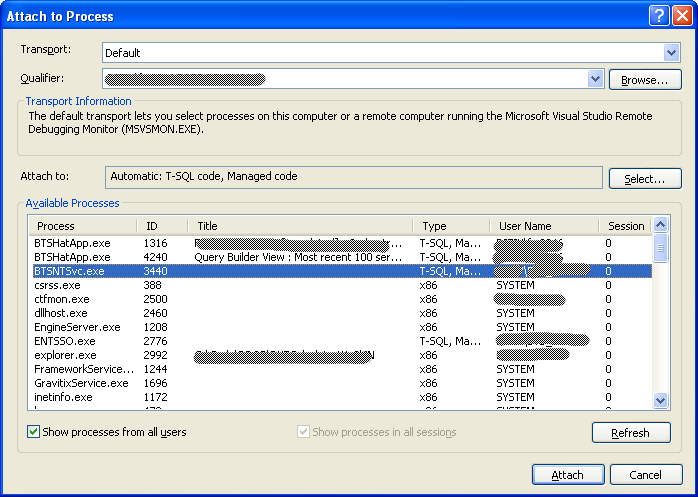
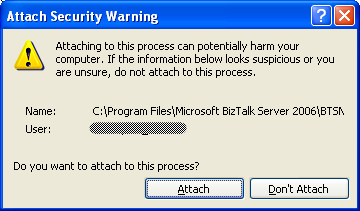
- Select the process that you want to debug and click Attach. In our case we want to debug a BizTalk application so the BizTalk process (BTSNTSvc.exe) was chosen. Confirm “Attach” on the security warning dialog.
That’s it, it is now possible to debug on the remote server! For BizTalk scenarios this can prove very powerful to debug orchestrations when the Orchestration debugger is not enough or when we want to debug a .Net library that is loaded as part of some BizTalk processing (pipelines, orchestrations, maps …).

